Phasor Analysis#
Generating Phasor Plots#
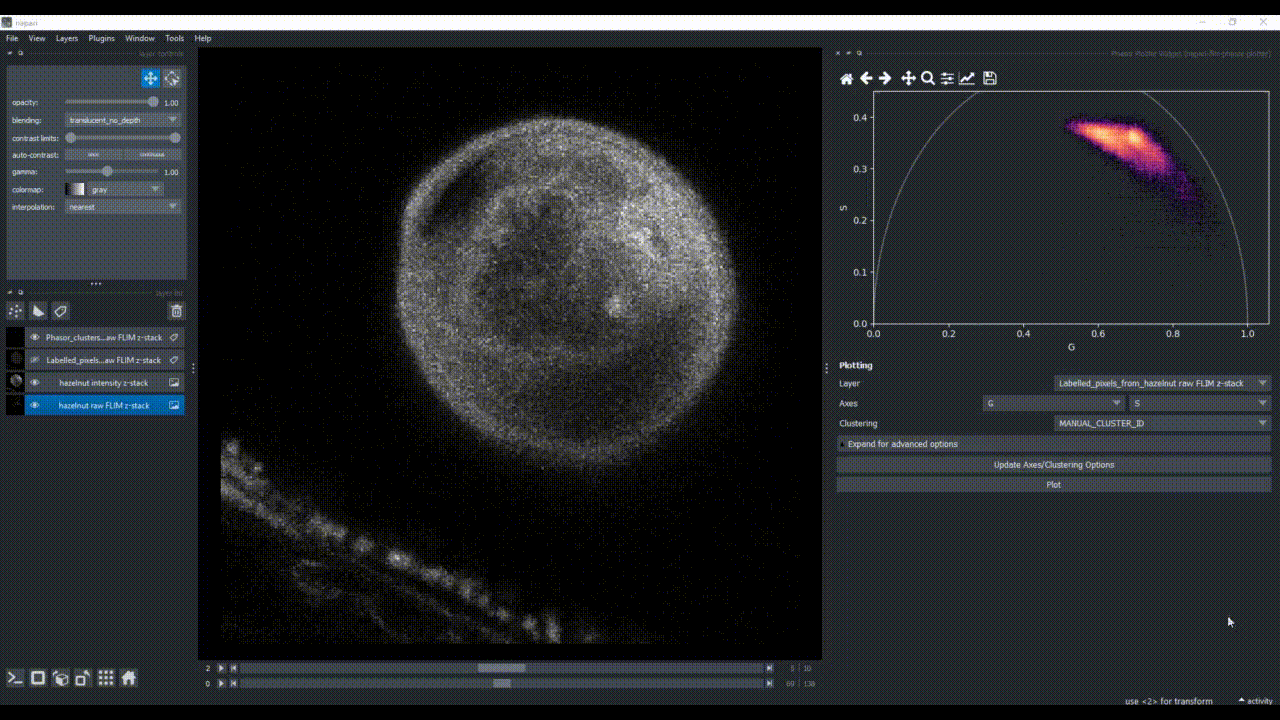
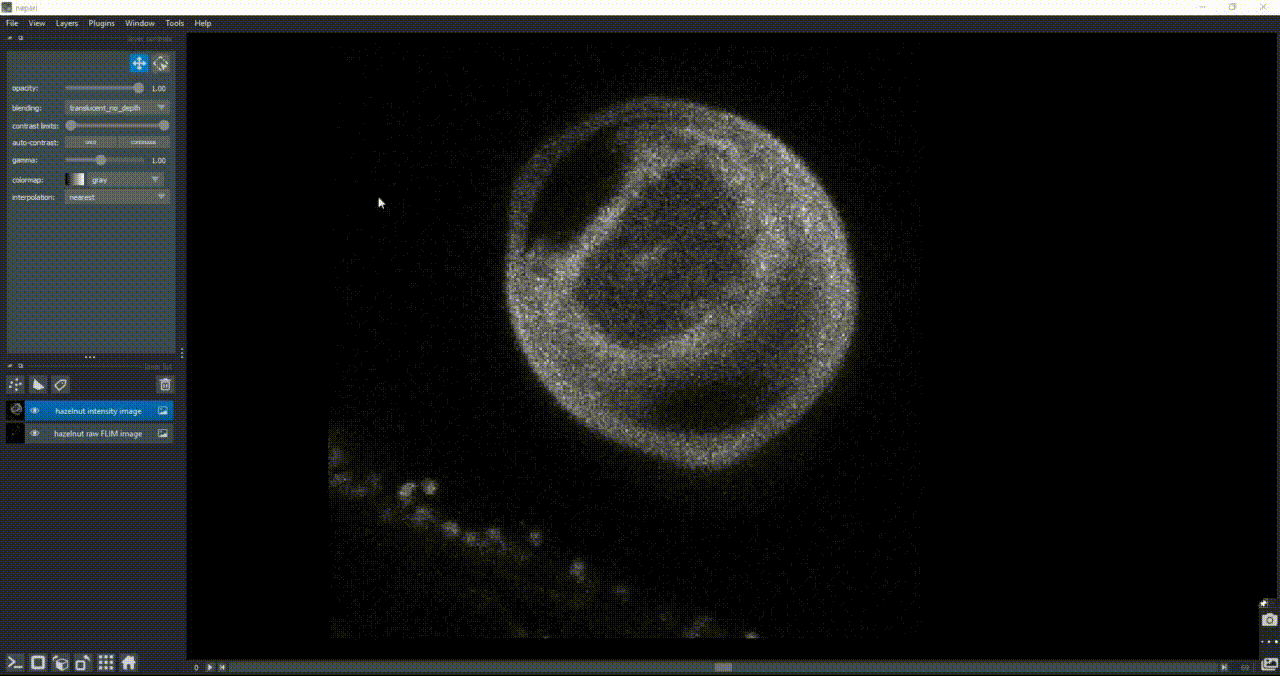
Call the plugin from the menu Plugins > FLIM phasor plotter > Calculate Phasors (or Layers -> Data -> Phasors -> Calculate Phasors if napari version >= 0.5.0) to generate a phasor plot by pixel-wise Fourier transformation of the decay data. Hereby, select the FLIM image to be used (it should be the layer with the raw data), specify the laser pulse frequency in MHz (if information is present in the file metadata, this field will be updated after phasor calculation). Choose a harmonic for optimal visualization, define an intensity threshold (here in absoluete values) to exclude pixels of low photon counts, and optionally apply a number of iterations n of a 3x3 median filter. Run creates the phasor plot and an additional labels layer in the layer list.
If a calibration sample with known lifetime is available, optionally load it as a napari layer and check the apply calibration checkbox to have access to a field to write the lifetime value (in ns) and apply it. Click on Run again to apply the calibration.
Phasor Plot Selection#
Manually encircle a region of interest in the phasor plot to highlight the corresponding pixels in the newly created image layer. Hold SHIFT to select and visualize several clusters with different colors, as a way to investigate image regions of similar FLIM patterns.